By
Cassian Mosha
TREE
DATA
|
Age of
Tree |
100's Board
Feet |
|
20 |
1 |
|
40 |
6 |
|
60 |
|
|
80 |
33 |
|
100 |
56 |
|
120 |
88 |
|
140 |
|
|
160 |
182 |
|
180 |
|
|
200 |
320 |
This
data is from the lumber industry, giving the approximate number of board feet
of lumber per tree in a forest of a given age. What function will fit the data?
Predict the harvest for ages other than those given. i.e at age 60,140, and
180.
Solution:
We can predict it to be an exponential function. But what is exponential function and what does it normally does? The exponential function is a function in mathematics. The application of this function to a value x is written as exp(x). Equivalently, this can be written in the form ex, where e is a mathematical constant, the base of the natural logarithm, which equals approximately 2.718281828, and is also known as Euler's number. The exponential function is nearly flat (climbing slowly) for negative values of x, climbs quickly for positive values of x, and equals 1 when x is equal to 0. Its y value always equals the slope at that point. As a function of the real variable x, the graph of y=ex is always positive (above the x axis) and increasing (viewed left-to-right). It never touches the x axis, although it gets arbitrarily close to it (thus, the x axis is a horizontal asymptote to the graph). Its inverse function, the natural logarithm, ln(x), is defined for all positive x. The exponential function is occasionally referred to as the anti-logarithm. However, this terminology seems to have fallen into disuse in recent times. Sometimes, especially in the sciences, the term exponential function is more generally used for functions of the form kax, where a, called the base, and it is any positive real number not equal to one. In general, the variable x can be any real or complex number, or even an entirely different kind of mathematical object. Exponential growth is "bigger" and "faster" than polynomial growth. This means that, no matter what the degree is on a given polynomial, a given exponential function will eventually be bigger than the polynomial. Even though the exponential function may start out really, really small, it will eventually overtake the growth of the polynomial, since it doubles all the time. We will sketch the graph and find out whether our prediction is right or wrong. When we find the best fit wheter exponential, quadratic or any other polynomial function we will use it to compute the values for board feet for ages 60, 140, and 180.

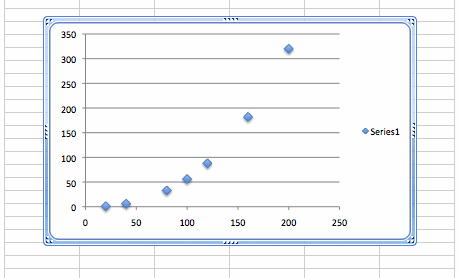
Figure 1Tree Data Graph
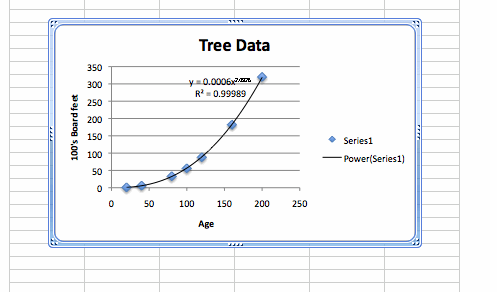
Now with the graph above we got the scatter plot which may hint an idea that may be the best fit will be exponential or some power of exponential. Using excel I chose power exponential function and examine the trend line of the data, and with it I chose the best fit.

Figure 2 Data Tree Trend Line
The equation displayed was ![]() with the R square equals .9999. I chose this equation because the Rsquare was so close to 1 compared to the other best fit such as polynomials ,exponetial or linear. Their Rsquares were also close to 1, but not as close as this one the power series fit. Using the equatuon given we can now find what will be the volume for the trees that their ages were not given.
with the R square equals .9999. I chose this equation because the Rsquare was so close to 1 compared to the other best fit such as polynomials ,exponetial or linear. Their Rsquares were also close to 1, but not as close as this one the power series fit. Using the equatuon given we can now find what will be the volume for the trees that their ages were not given.

Figure 3
For the tree with age 60years old the amount of 100's boardfeet that will produce will be 
For 140 years the volume will be

For 180 years, the volume will be

Therefore we can now conclude that for a tree that is 60yeras old it will produce nearly 1,623board feet of timber, while for ages 140 and 180 will produce 13,415 and 25,100 board feet repectively. The data shows that as the older the tree get, the higher the volume it produces.